Complex Sales Report (Javascript)
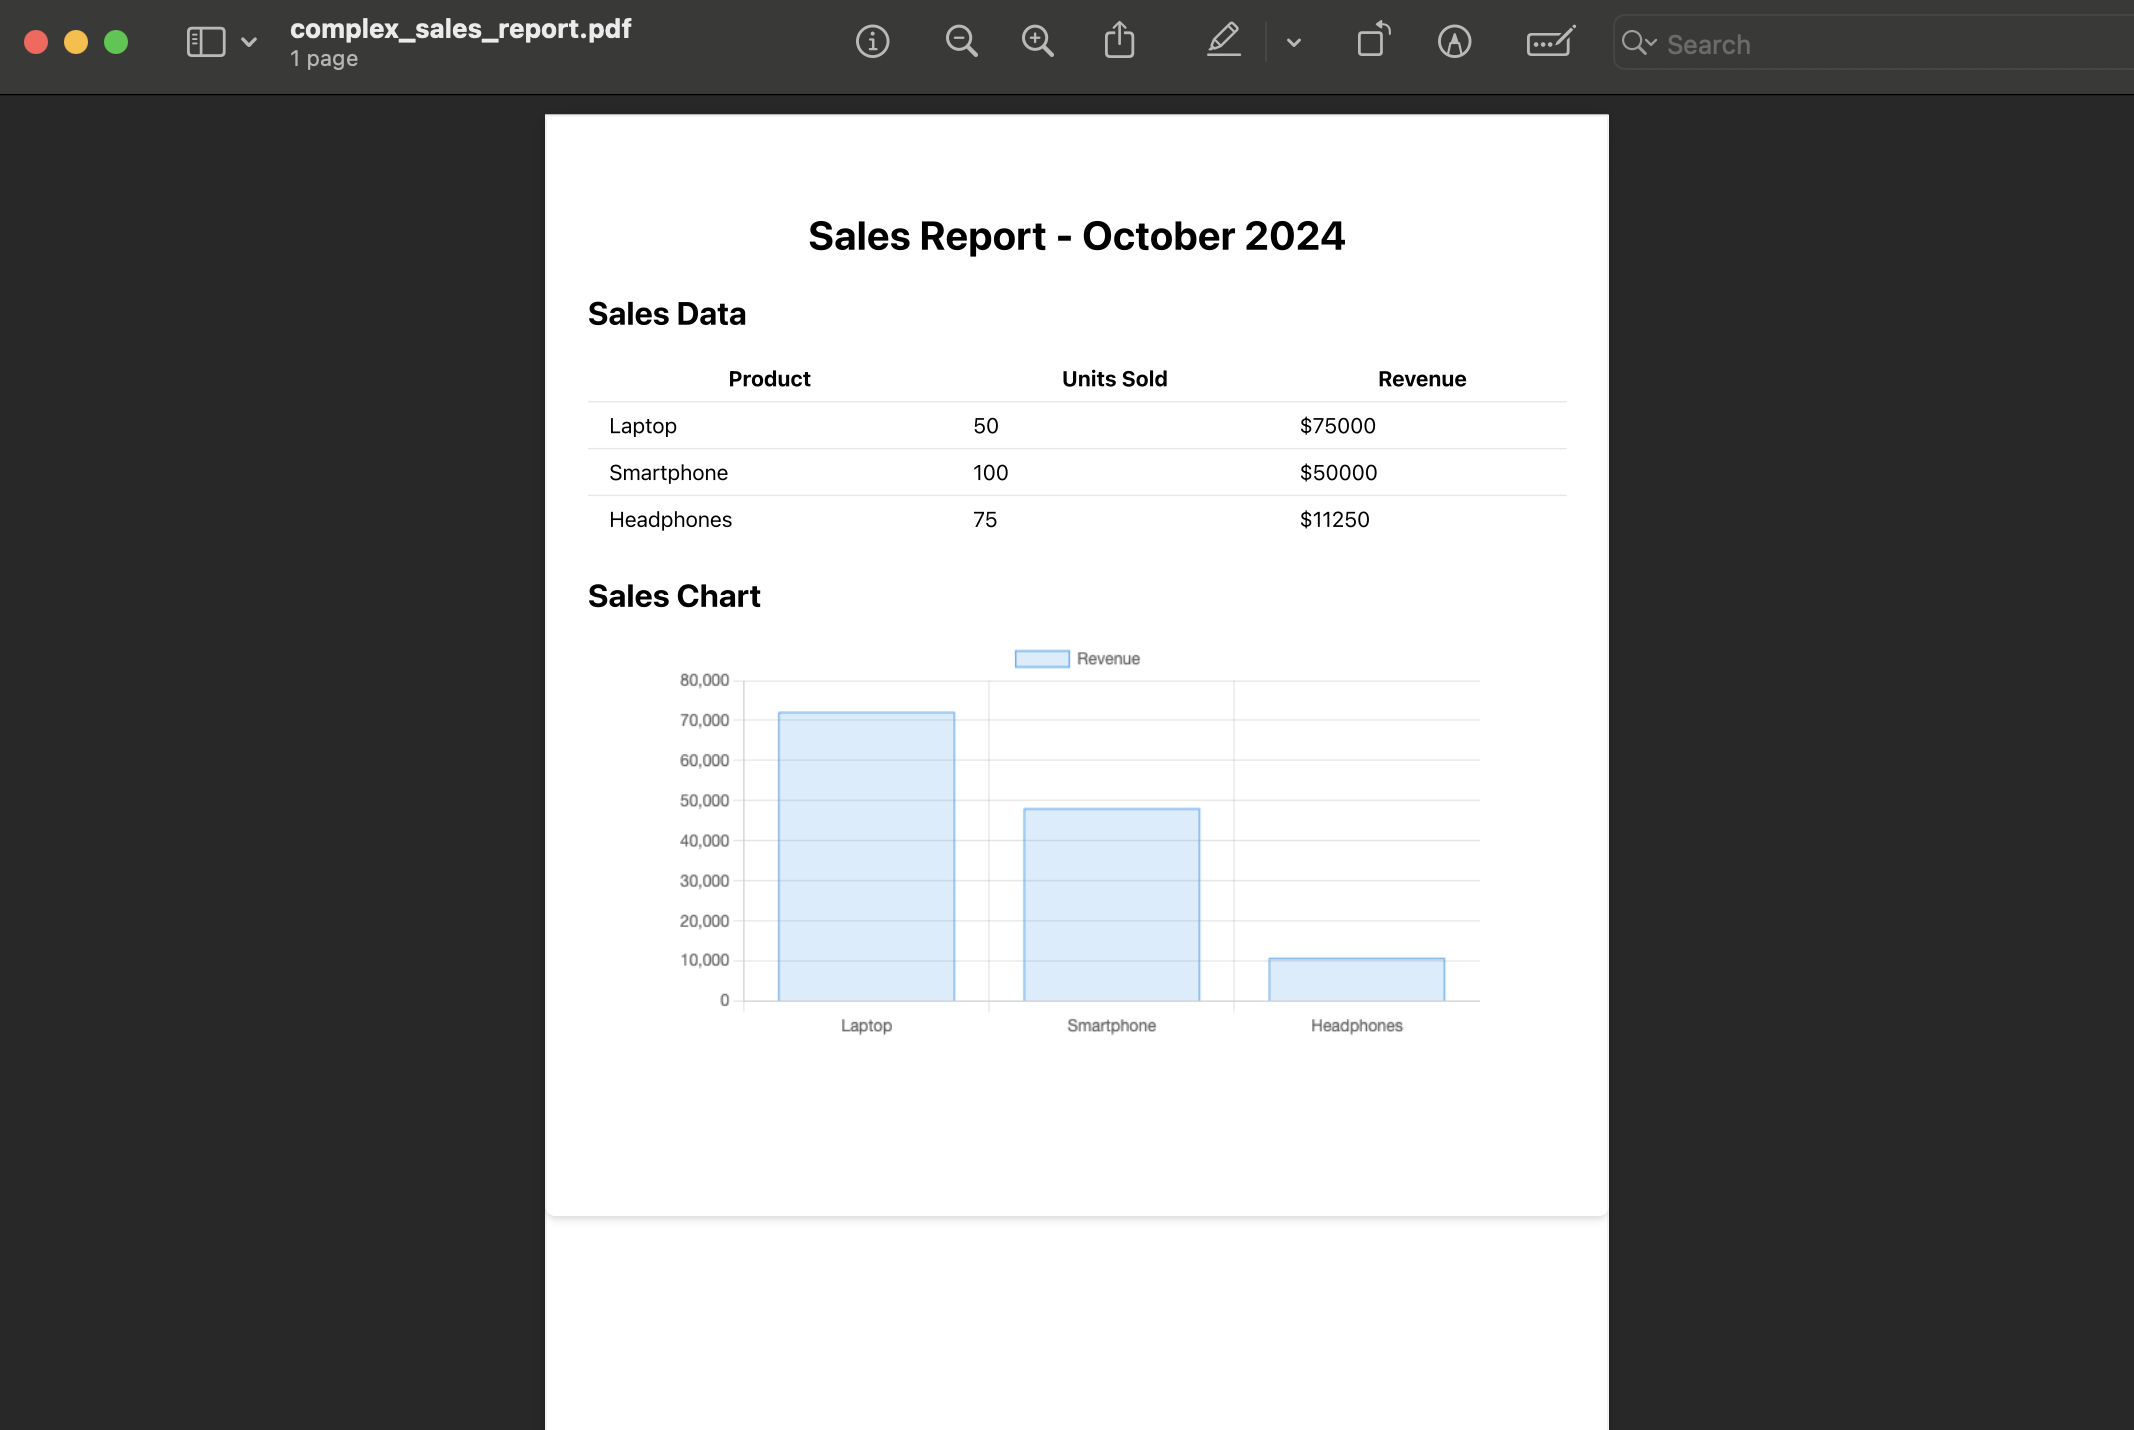
This example demonstrates how to generate a complex sales report using the GoTempl engine. The report contains sales data, a dynamic chart using Chart.js, conditionals to display warnings, and loops to generate tables. The layout is styled using Tailwind CSS. This report is generated synchronously via the /generate-pdf-sync endpoint.
Step-by-Step Guide:
1. Prepare the HTML Template
This is the GoTempl-based HTML template used to generate the complex sales report. It includes:
- Charts: Rendered with Chart.js.
- Conditionals: A warning is shown if the total sales are below a threshold.
- Loops: Used to generate tables of sales data.
- Tailwind CSS: For layout and styling.
<html>
  <head>
    <meta charset="UTF-8">
    <meta name="viewport" content="width=device-width, initial-scale=1.0">
    <script src="https://cdn.tailwindcss.com"></script>
    <script src="https://cdn.jsdelivr.net/npm/chart.js"></script>
    <title>Sales Report</title>
    <style>
      .chart-container {
        width: 600px;
        height: 400px;
        margin: 0 auto;
      }
    </style>
  </head>
  <body class="bg-gray-100">
    <div class="max-w-4xl mx-auto bg-white p-8 mt-10 rounded-lg shadow-md">
      <h1 class="text-3xl font-bold text-center mb-6">Sales Report - {{.Month}} {{.Year}}</h1>

      <!-- Conditional: Show message if sales are low -->
      {{if lt .TotalSales 1000.0}}
      <p class="text-red-500 text-center font-semibold">Warning: Sales are lower than expected this month.</p>
      {{end}}

      <!-- Sales Data Table -->
      <h2 class="text-2xl font-bold mb-4">Sales Data</h2>
      <table class="min-w-full table-auto mb-6">
        <thead>
          <tr class="bg-gray-200">
            <th class="px-4 py-2">Product</th>
            <th class="px-4 py-2">Units Sold</th>
            <th class="px-4 py-2">Revenue</th>
          </tr>
        </thead>
        <tbody>
          {{range .SalesData}}
          <tr class="border-t">
            <td class="px-4 py-2">{{.Product}}</td>
            <td class="px-4 py-2">{{.UnitsSold}}</td>
            <td class="px-4 py-2">\${{.Revenue}}</td>
          </tr>
          {{end}}
        </tbody>
      </table>

      <!-- Sales Chart -->
      <h2 class="text-2xl font-bold mb-4">Sales Chart</h2>
      <div class="chart-container">
        <canvas id="salesChart"></canvas>
      </div>

      <script>
        var ctx = document.getElementById('salesChart').getContext('2d');
        var salesChart = new Chart(ctx, {
          type: 'bar',
          data: {
            labels: [{{range $index, $element := .ChartData.Labels}}{{if $index}},{{end}}"{{$element}}"{{end}}],
            datasets: [{
              label: 'Revenue',
              data: [{{range $index, $element := .ChartData.Values}}{{if $index}},{{end}}{{$element}}{{end}}],
              backgroundColor: 'rgba(54, 162, 235, 0.2)',
              borderColor: 'rgba(54, 162, 235, 1)',
              borderWidth: 1
            }]
          },
          options: {
            scales: {
              y: {
                beginAtZero: true
              }
            }
          }
        });
      </script>
    </div>
  </body>
</html>
2. Submit the Template Using JavaScript
Here’s the JavaScript code to submit the template and generate the PDF using the Fetch API. This will create the sales report asynchronously and store it as complex_sales_report.pdf.
const fetch = require('node-fetch');
const fs = require('fs');

// Define the HTML template (GoTempl)
const htmlTemplate = `
<html>
  <head>
    <meta charset="UTF-8">
    <meta name="viewport" content="width=device-width, initial-scale=1.0">
    <script src="https://cdn.tailwindcss.com"></script>
    <script src="https://cdn.jsdelivr.net/npm/chart.js"></script>
    <title>Sales Report</title>
    <style>
      .chart-container {
        width: 600px;
        height: 400px;
        margin: 0 auto;
      }
    </style>
  </head>
  <body class="bg-gray-100">
    <div class="max-w-4xl mx-auto bg-white p-8 mt-10 rounded-lg shadow-md">
      <h1 class="text-3xl font-bold text-center mb-6">Sales Report - {{.Month}} {{.Year}}</h1>

      <!-- Conditional: Show message if sales are low -->
      {{if lt .TotalSales 1000.0}}
      <p class="text-red-500 text-center font-semibold">Warning: Sales are lower than expected this month.</p>
      {{end}}

      <!-- Sales Data Table -->
      <h2 class="text-2xl font-bold mb-4">Sales Data</h2>
      <table class="min-w-full table-auto mb-6">
        <thead>
          <tr class="bg-gray-200">
            <th class="px-4 py-2">Product</th>
            <th class="px-4 py-2">Units Sold</th>
            <th class="px-4 py-2">Revenue</th>
          </tr>
        </thead>
        <tbody>
          {{range .SalesData}}
          <tr class="border-t">
            <td class="px-4 py-2">{{.Product}}</td>
            <td class="px-4 py-2">{{.UnitsSold}}</td>
            <td class="px-4 py-2">\${{.Revenue}}</td>
          </tr>
          {{end}}
        </tbody>
      </table>

      <!-- Sales Chart -->
      <h2 class="text-2xl font-bold mb-4">Sales Chart</h2>
      <div class="chart-container">
        <canvas id="salesChart"></canvas>
      </div>

      <script>
        var ctx = document.getElementById('salesChart').getContext('2d');
        var salesChart = new Chart(ctx, {
          type: 'bar',
          data: {
            labels: [{{range $index, $element := .ChartData.Labels}}{{if $index}},{{end}}"{{$element}}"{{end}}],
            datasets: [{
              label: 'Revenue',
              data: [{{range $index, $element := .ChartData.Values}}{{if $index}},{{end}}{{$element}}{{end}}],
              backgroundColor: 'rgba(54, 162, 235, 0.2)',
              borderColor: 'rgba(54, 162, 235, 1)',
              borderWidth: 1
            }]
          },
          options: {
            scales: {
              y: {
                beginAtZero: true
              }
            }
          }
        });
      </script>
    </div>
  </body>
</html>
`;

// Define the sales data and chart data
const requestData = {
  html_template: htmlTemplate,
  data: {
    Month: "October",
    Year: "2024",
    TotalSales: 1200.00,
    SalesData: [
      { Product: "Laptop", UnitsSold: 50, Revenue: 75000 },
      { Product: "Smartphone", UnitsSold: 100, Revenue: 50000 },
      { Product: "Headphones", UnitsSold: 75, Revenue: 11250 }
    ],
    ChartData: {
      Labels: ["Laptop", "Smartphone", "Headphones"],
      Values: [75000, 50000, 11250]
    }
  },
  engine: 'gotempl', // Use GoTempl engine
};

// API Key
const apiKey = 'YOUR_API_KEY';

// Function to generate the PDF using Fetch API
async function generatePDF() {
  try {
    const response = await fetch('https://reportgen.io/api/v1/generate-pdf-sync', {
      method: 'POST',
      headers: {
        'X-API-Key': apiKey,
        'Content-Type': 'application/json',
      },
      body: JSON.stringify(requestData),
    });

    if (!response.ok) {
      throw new Error(`Error generating PDF: ${response.statusText}`);
    }

    const pdfBuffer = await response.buffer();
    fs.writeFileSync('complex_sales_report.pdf', pdfBuffer);
    console.log('PDF successfully generated and saved as complex_sales_report.pdf');
  } catch (error) {
    console.error('Error generating PDF:', error.message);
  }
}

// Run the function to generate the PDF
generatePDF();
3. Explanation
- HTML Template: Contains a sales report using conditionals, loops, and chart generation with Chart.js.
- Tailwind CSS: Used for styling the report layout.
- JavaScript Code: Submits the HTML template and sales data to the reportgen API using the Fetch API and saves the generated PDF file locally as
complex_sales_report.pdf.
4. Running the Script
You can run the script with:
node script.js
Make sure to replace YOUR_API_KEY with your actual API key.